DMN Analytics
Champa Intelligence provides powerful analytics for your Decision Model and Notation (DMN) tables, transforming them from black boxes into transparent, analyzable assets. This feature helps you understand how your business rules are being executed in the real world.
Overview
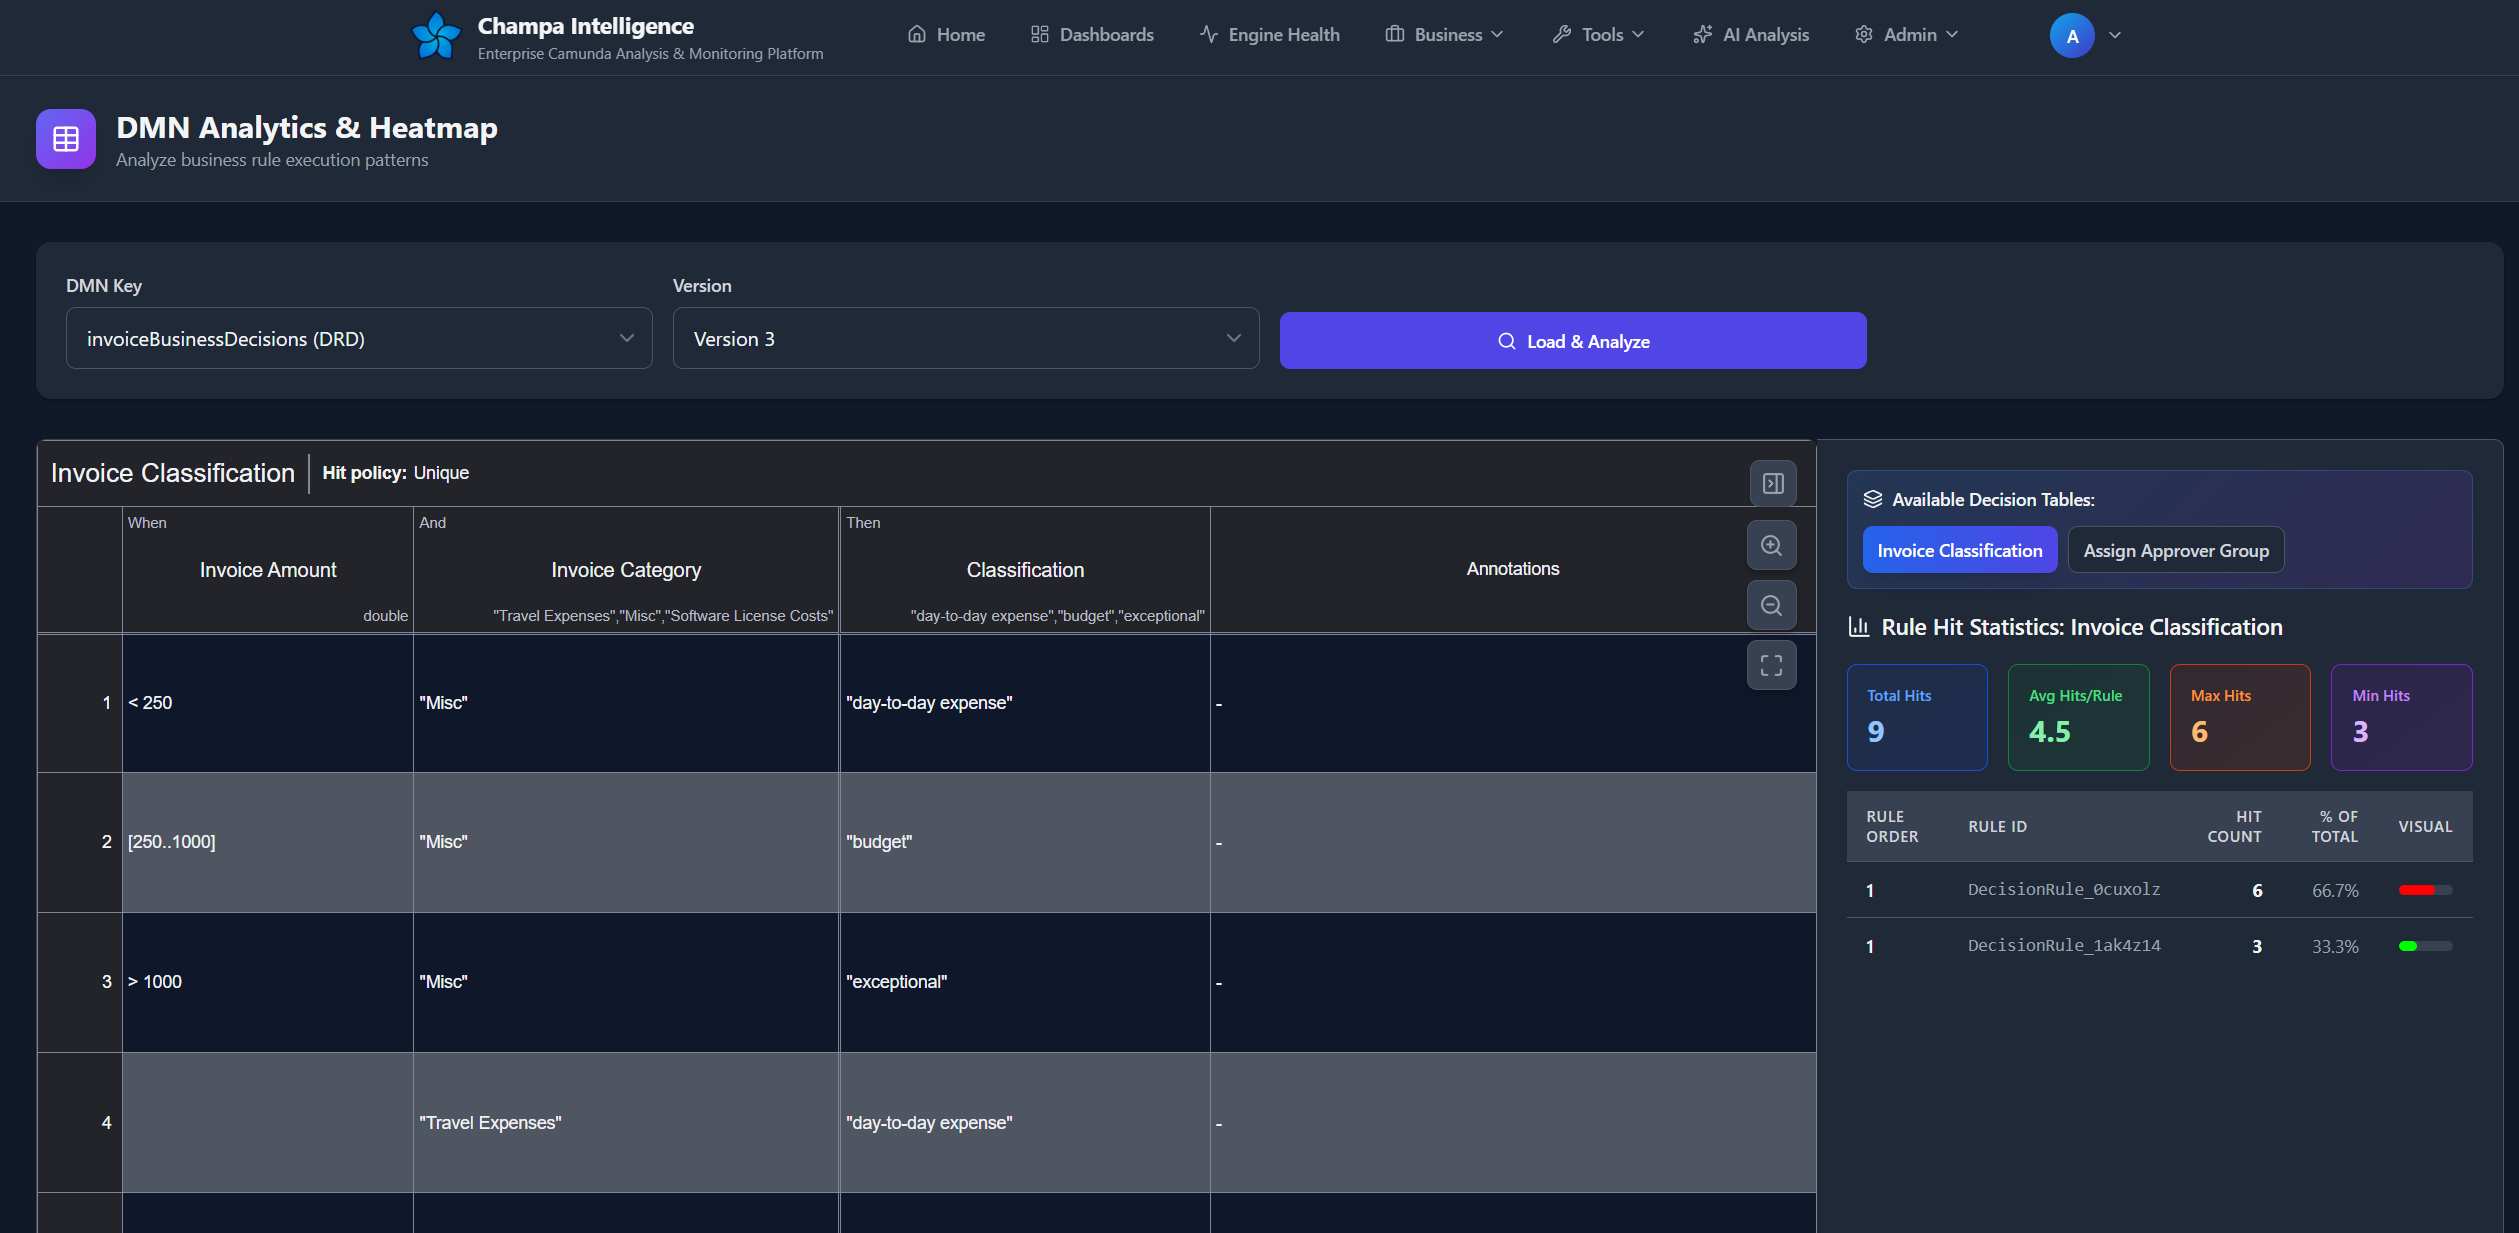
DMN Analytics provides real-time visualization of how your business rules execute in production. Color-coded heatmaps show which rules fire most frequently, helping optimize decision logic and identify unused rules.
Key Features
- 🎨 Interactive Heatmaps - Color-coded rule execution frequency
- 📊 Hit Statistics - Detailed execution metrics per rule
- 🗺️ DRD Support - Decision Requirements Diagram visualization
- 🔄 Multi-Table Navigation - Switch between related decision tables
- 📈 Performance Insights - Identify hot paths and dead rules
How It Works
Data Collection
graph LR
    A[DMN Execution] --> B[Camunda Engine]
    B --> C[Historic Decision Instance]
    C --> D[DMN Analytics]
D --> E[Heatmap Visualization]Process:
- DMN tables execute during process instances
- Camunda logs each decision evaluation
- Analytics aggregate rule hits by decision key + version
- Heatmap overlays execution frequency on visual table
Color Coding: - 🟢 Green → Low frequency (cool) - 🟡 Yellow → Medium frequency (warm) - 🔴 Red → High frequency (hot)
Quick Start
Step 1: Select DMN
Navigate to /dmn-analytics
Select from dropdown:
DMN Types:
- (DRD) - Decision Requirements Diagram (multiple tables)
- (DMN in DRD) - Individual decision in a diagram
- Standalone - Single decision table
Step 2: Load & Analyze
Click "Load & Analyze" button
Loading process:
- Fetches DMN XML from database
- Migrates to DMN 1.3 if needed (from 1.1 or 1.2)
- Loads execution statistics
- Renders diagram
- Applies heatmap overlay
Step 3: View Results
Decision Table View:
- Color-coded rows by hit frequency
- Hit count badges on rules
- Statistics panel (right side)
- Scroll to see full table
DRD View:
- Visual decision diagram
- Summary statistics per table
- Click table to drill down
Interface Guide
Main Layout
┌─────────────────────────────────────────┬──────────────┐
│                                         │              │
│           DMN Canvas                    │  Statistics  │
│     (Decision Table or DRD)             │    Panel     │
│                                         │              │
│                                         │              │
└─────────────────────────────────────────┴──────────────┘
Controls
Top Right Corner:
- 📊 Toggle statistics panel (expand/collapse)
Zoom Controls (right side):
- 🔍+ Zoom in
- 🔍- Zoom out
- ⛶ Fit viewport (DRD only)
Keyboard/Mouse:
- Scroll: Vertical/horizontal navigation
- Drag (DRD): Pan diagram
- Click decision (DRD): Open table
Statistics Panel
For Decision Tables:
Summary Cards:
┌─────────────┬─────────────┬─────────────┬─────────────┐
│ Total Hits  │ Avg/Rule    │   Max Hits  │   Min Hits  │
│   12,450    │    498.0    │    2,834    │      0      │
└─────────────┴─────────────┴─────────────┴─────────────┘
Rule Details Table:
| Rule Order | Rule ID | Hit Count | % of Total | Visual |
|---|---|---|---|---|
| 1 | rule_premium_15 | 2,834 | 22.8% | ████████ |
| 2 | rule_standard_10 | 1,456 | 11.7% | ████ |
For DRD:
Shows summary for each decision table:
┌──────────────────────────────────┐
│ determine-discount               │
│ Rules: 5                         │
│ Total Hits: 12,450              │
│ Avg Hits/Rule: 2,490.0          │
└──────────────────────────────────┘
Understanding Heatmaps
Color Interpretation
Gradient Scale:
What Heatmaps Reveal
Hot Rules (Red/Orange):
- Most frequently executed
- Business rule workhorses
- Prime optimization targets
- Highest testing priority
Cold Rules (Green):
- Rarely executed
- Edge case handlers
- Potential dead code
- May need review
Zero Hits (White/No Color):
- Never executed
- Possible issues:
- Unreachable conditions
- Redundant logic
- Misconfigured expressions
- Missing test coverage
Use Cases
Rule Optimization
Scenario: Optimize performance-critical decisions
- Load DMN with heatmap
- Identify hottest rules (red)
- Review rule logic
- Optimize:
- Simplify complex expressions
- Cache expensive calculations
- Reorder rules (check fast conditions first)
- Split into multiple decisions
Example:
Rule 3: 45% of hits, complex calculation
→ Extract calculation to process variable
→ Use simpler condition in DMN
→ Performance improved 3x
Dead Rule Detection
Scenario: Clean up unused business logic
- Load production DMN
- Filter rules with 0 hits
- Investigate why:
- Overlapping conditions?
- Impossible to reach?
- Legacy from old requirements?
- Options:
- Remove if truly dead
- Add test cases if valid edge case
- Fix conditions if bug
Business Insights
Scenario: Understand decision outcomes
Example - Loan Approval:
Rule 1 (Approved):     35% of decisions
Rule 2 (Manual Review): 52% of decisions
Rule 3 (Rejected):     13% of decisions
Insights:
- Most loans go to manual review
- Opportunity to automate more approvals
- Rejection rate acceptable
- Focus on reducing manual review bottleneck
Testing & Validation
Scenario: Ensure comprehensive test coverage
Before deployment:
- Run test suite
- Load DMN analytics
- Check rule coverage
- Add tests for unexecuted rules
Multi-Table DMN
DRD Navigation
Decision Requirements Diagram shows relationships between decisions.
Example:
┌─────────────────┐
│ Calculate Price │
└────────┬────────┘
         │ uses
    ┌────▼─────┐      ┌──────────────┐
    │ Discount │──────│ Customer Tier│
    └──────────┘      └──────────────┘
Navigation:
- DRD view shows all decisions
- Click decision node → Opens that table
- View statistics for specific table
- Navigate between tables using panel buttons
Table Switching
When multiple tables exist:
Top of statistics panel shows:
┌─────────────────────────────────────────┐
│ Available Decision Tables:              │
│                                         │
│ [Discount Rules] [Customer Tier] [VAT] │
└─────────────────────────────────────────┘
- Blue button = Currently active
- Gray buttons = Available tables
- Click to switch instantly
Best Practices
Performance Monitoring
Regular Reviews:
Weekly: Check hot rules for optimization opportunities
Monthly: Audit dead rules and update test coverage
Quarterly: Analyze decision distribution trends
Rule Maintenance
Workflow:
- Deploy new DMN version
- Run smoke tests
- Check heatmap after 24 hours
- Verify expected rule distribution
- Investigate anomalies
Testing Strategy
Coverage goals:
Production Critical: 100% rule coverage
Standard Business Rules: 90% coverage
Edge Cases: 70% coverage
Use heatmap to:
- Identify untested rules
- Focus testing on hot paths
- Validate rare conditions fire correctly
Next Steps
- AI Analysis - AI insights on DMN execution patterns
- Process Intelligence - How DMN fits in process flow