Journey Monitoring
 End-to-end journey tracing with interactive visualizations and pattern analysis
Overview
Journey Monitoring solves one of the most challenging problems in modern process orchestration: understanding the complete customer journey across multiple, decoupled process models. While standard BPM tools show you what happens inside a single process, Journey Monitoring reveals the entire end-to-end experience, including the critical "invisible" time spent waiting between processes.
The Problem: Siloed Process Views
In microservices and event-driven architectures, a single business transaction often flows through multiple independent Camunda processes:
Customer Order Journey:
┌─────────────────┐    ┌──────────────────┐    ┌─────────────────┐    ┌──────────────────┐
│ Order Entry     │───▶│ Payment Process  │───▶│ Inventory Check │───▶│ Fulfillment      │
└─────────────────┘    └──────────────────┘    └─────────────────┘    └──────────────────┘
  (Call Activity)         (Message Event)         (Call Activity)         (Async)
Traditional monitoring shows:
- ✓ Each process independently
- ✓ Activities within each process
- ✗ How long the customer actually waited
- ✗ Where integration bottlenecks occur
- ✗ The true end-to-end duration
Journey Monitoring reveals:
- ✓ Complete journey from start to finish
- ✓ Wait times between process handoffs
- ✓ Total customer experience duration
- ✓ Integration and messaging delays
- ✓ Common journey patterns and their performance
Key Capabilities
🔍 Single Journey Tracing
Trace any individual customer journey using a business key (order ID, customer ID, transaction ID) or a specific process instance ID.
What You Get:
- Complete Hierarchy View - See all related process instances organized as a tree, showing parent-child relationships through call activities and message correlations
- Timeline Visualization - Interactive timeline chart displaying all processes on a time axis, showing when each started, ended, and how they overlap
- Wait Time Analysis - Explicit calculation of "invisible" wait time between process handoffs
- Detailed Process Table - Expandable table with start/end times, durations, wait times, and drill-down into instance history
- Incident Tracking - All incidents that occurred anywhere in the journey, consolidated in one view
- Journey Statistics - Total duration, processing time, wait time, completion status, and depth metrics
📊 Pattern Analysis
Discover common journey paths and their performance characteristics across hundreds or thousands of instances.
What You Get:
- Automatic Pattern Discovery - Groups instances by their unique process path (e.g., "Order → Payment → Fulfillment" vs "Order → Payment → Cancellation → Refund")
- Pattern Frequency - See what percentage of journeys follow each path
- Performance Metrics per Pattern - Average, P95, max, and min durations for total journey and each step
- Step-by-Step Breakdown - Detailed performance analysis for each process in the pattern
- Wait Time Statistics - Average, P95, max, and min wait times between each step
- Sample Instances - Access to specific instances that followed each pattern for deeper investigation
How It Works
Business Key Correlation
Journey Monitoring uses business keys to connect related process instances:
- You search with a business key (e.g.,
ORDER-12345) - System normalizes the key (handles variations like
ORDER-12345_v2) - Finds ALL process instances with that business key
- Expands the network by traversing call activity relationships
- Builds a complete hierarchical tree of the journey
- Calculates wait times from timestamps
Supported Relationships: - Call Activities (parent-child via superProcessInstanceId) - Message Correlation (via shared business keys) - Signal Events (via shared business keys) - Multiple root processes (when parallel journeys exist)
Smart Business Key Normalization
The system intelligently handles business key variations:
Original Key          → Normalized Key
ORDER-12345          → ORDER-12345
ORDER-12345_retry    → ORDER-12345
ORDER-12345_test     → ORDER-12345
Configurable delimiters ensure your business key conventions work seamlessly.
Using Journey Monitoring
Single Journey Mode
Step 1: Search Enter a business key or process instance ID in the search field.
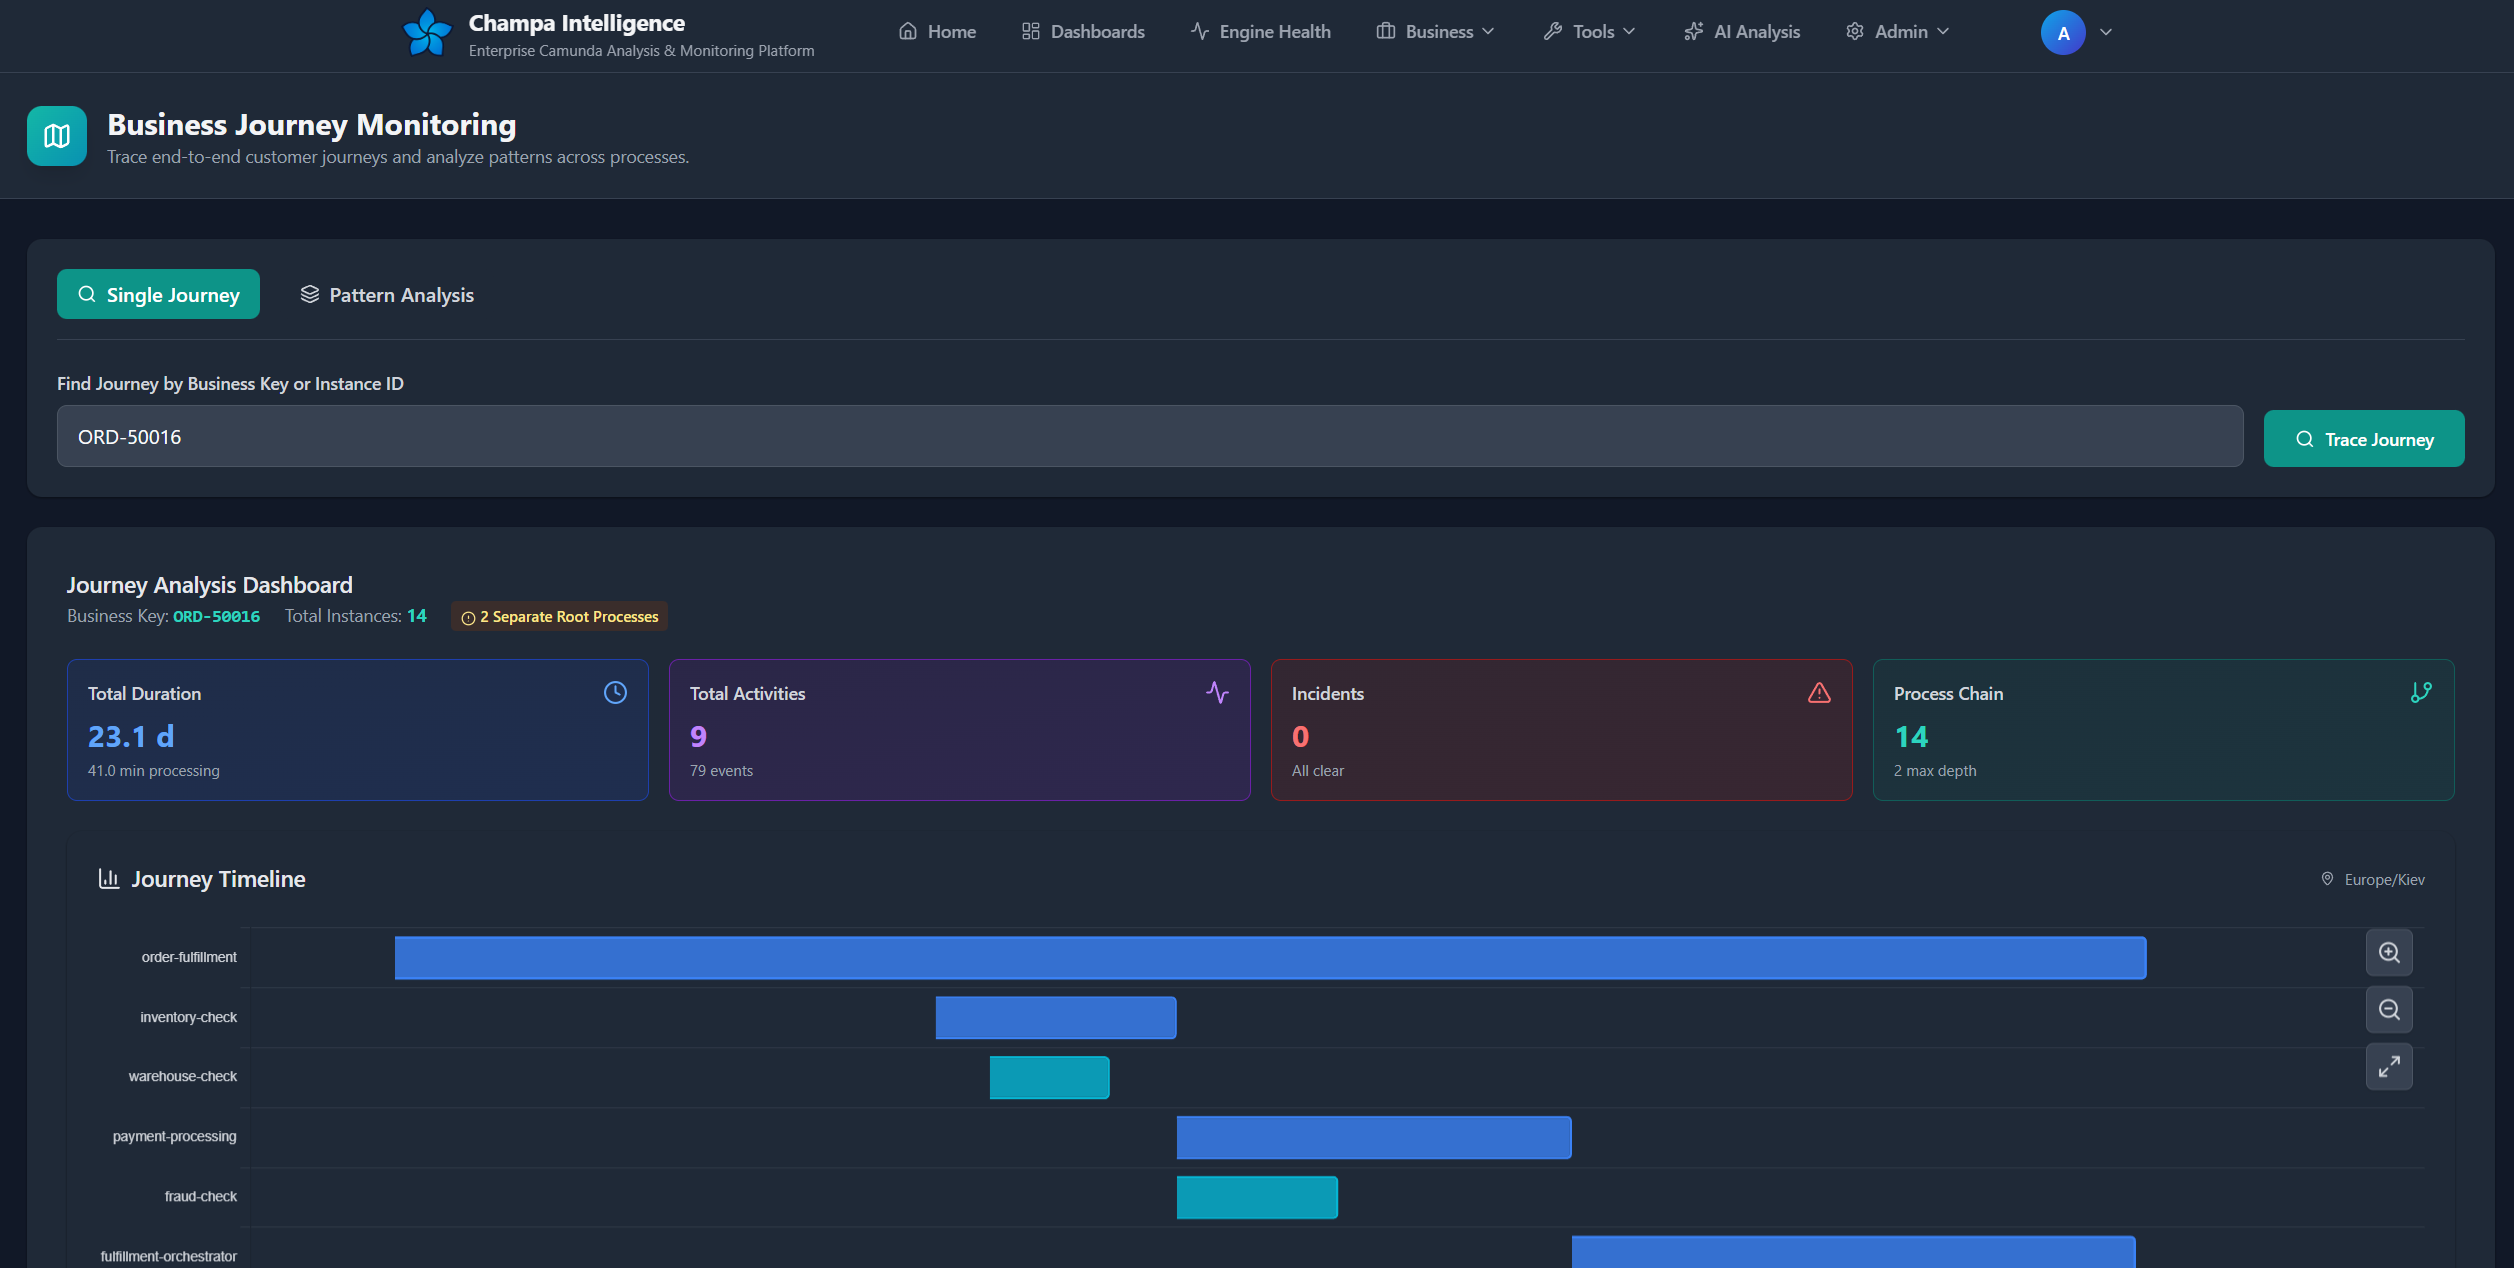
Step 2: View Overview Review the KPI cards showing:
- Total journey duration (start to end)
- Total activities executed
- Incidents encountered
- Process chain depth
Step 3: Explore Timeline The interactive timeline chart shows:
- Each process as a horizontal bar
- Color-coded by duration (green=fast, yellow=moderate, orange=slow, red=very slow)
- Running processes (green with pulse animation)
- Time axis with your local timezone
- Zoom and pan controls (drag to select, Ctrl+scroll to zoom, Shift+drag to pan)
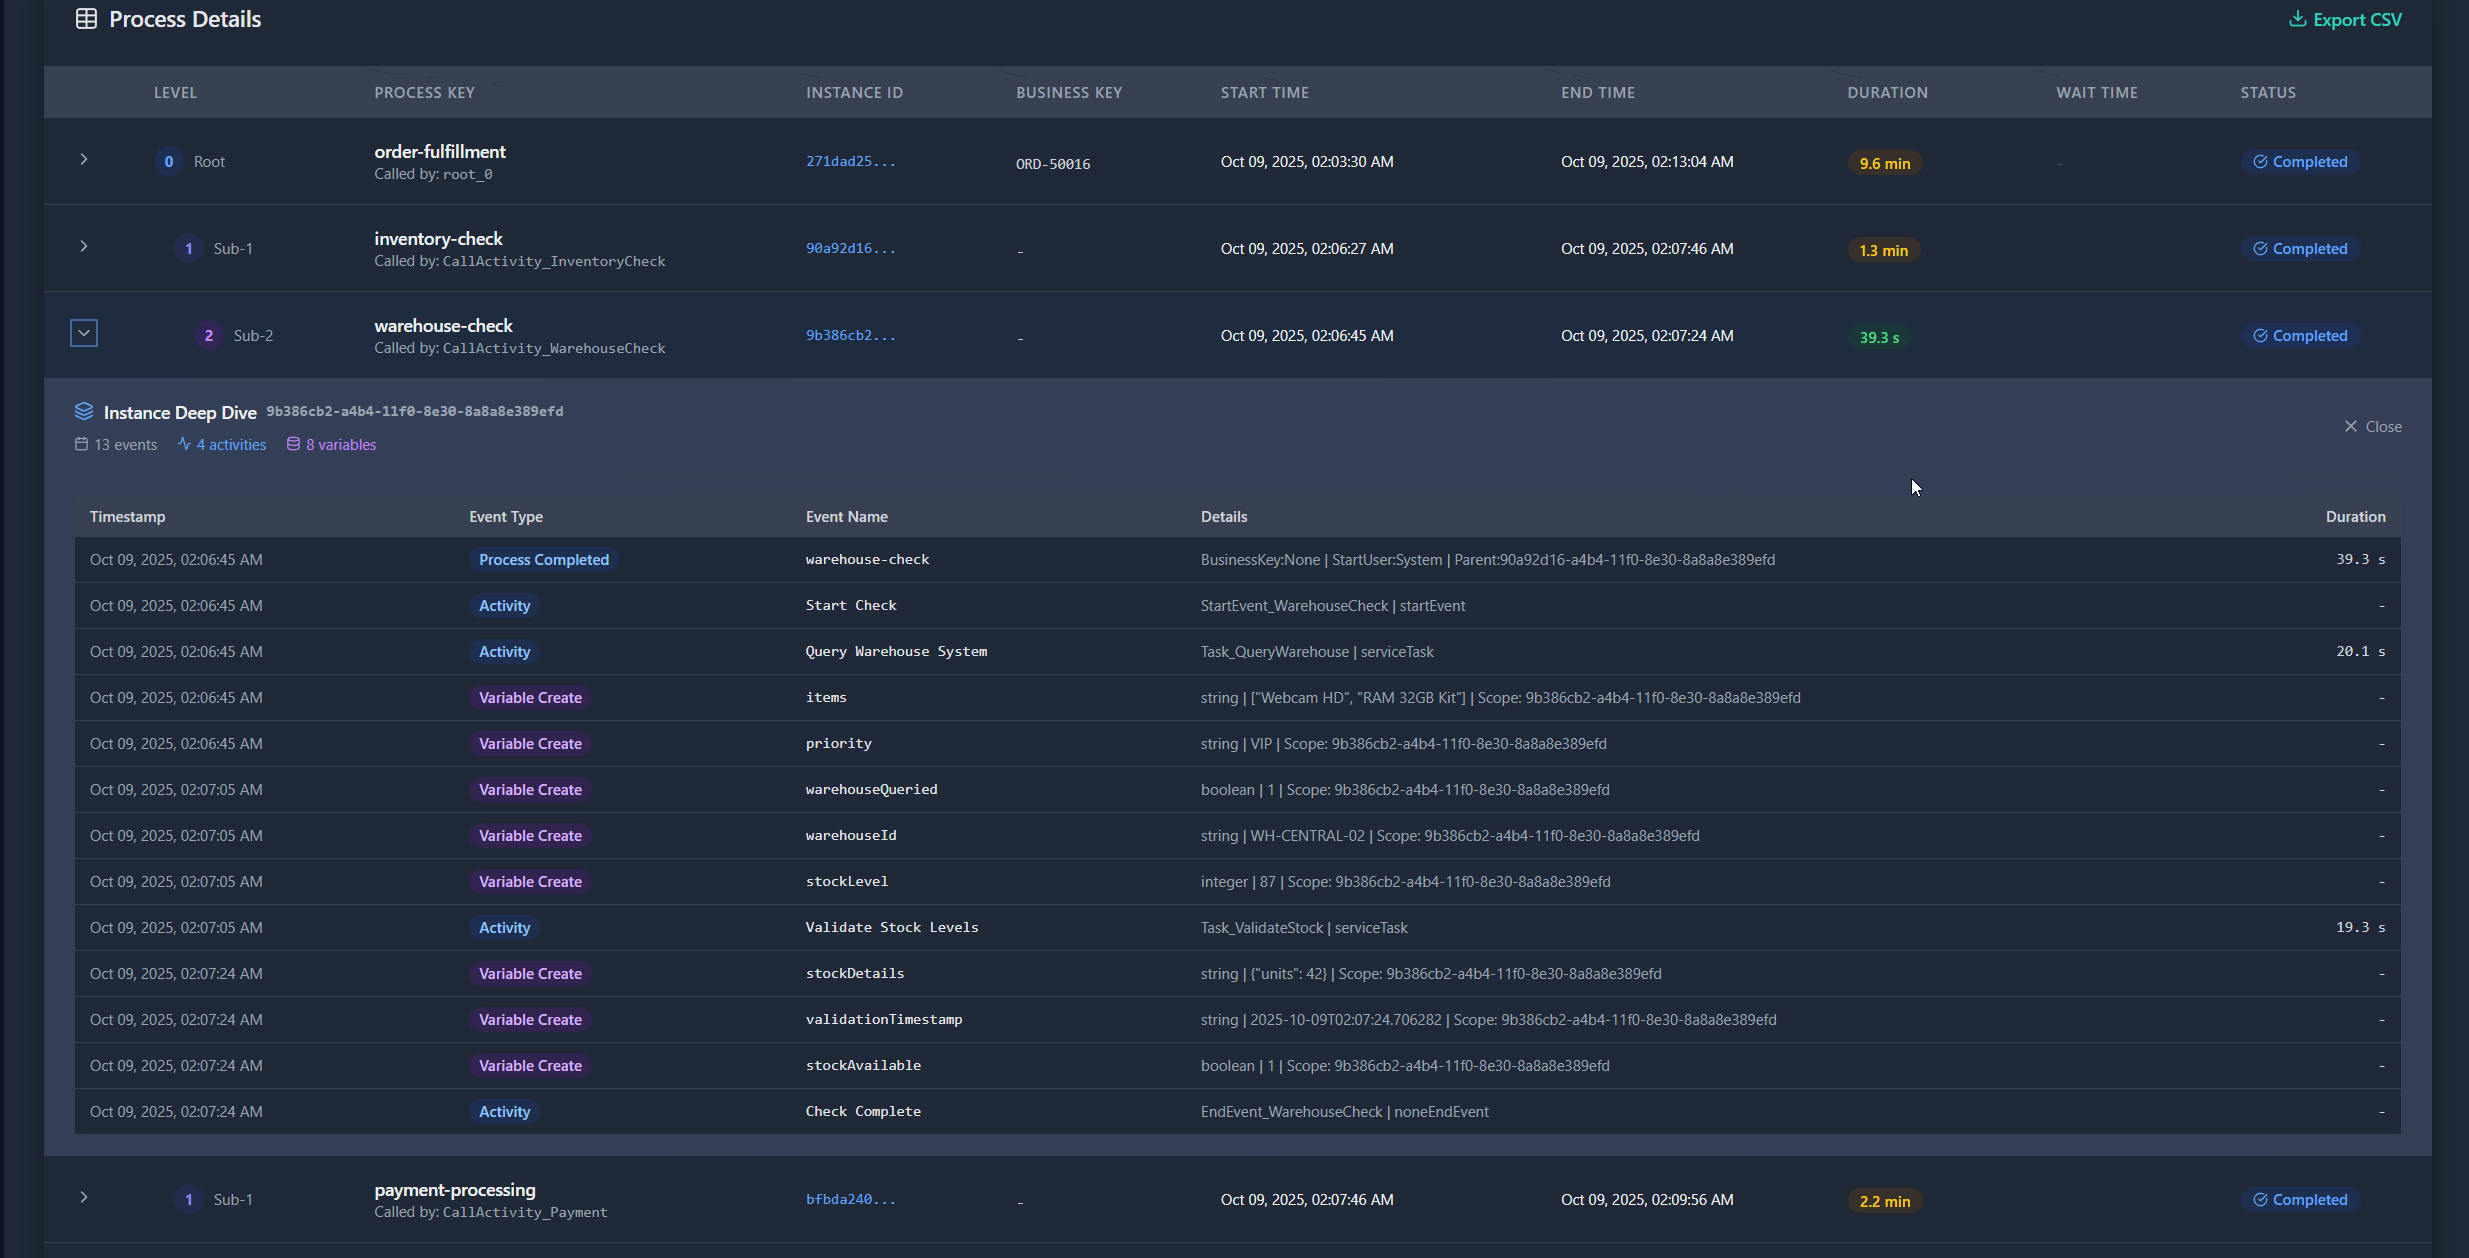
Step 4: Analyze Details The process table provides:
- Level Column - Visual indication of hierarchy depth
- Process Details - Name, instance ID, business key
- Timestamps - Start and end times in your local timezone
- Duration - Processing time with color-coded indicators
- Wait Time - Time between processes (amber badges)
- Status - Completed or running (animated)
- Expand Rows - Click chevron to see full instance history with all events, activities, variables, and incidents
Step 5: Review Incidents
If incidents occurred, expand the incidents section to see: - Incident type and error message - Which process and activity failed - When it occurred and if it was resolved
Step 6: Export Click "Export CSV" to download the complete journey data for further analysis or reporting.
Pattern Analysis Mode
Step 1: Select Process Choose a root process from the dropdown. The system loads available versions.
Step 2: Analyze Click "Analyze Patterns" to discover common journey paths.
Step 3: Review Patterns Each pattern shows:
- Pattern Visualization - Process flow as text (Process A → Process B → Process C)
- Frequency - Number and percentage of instances following this pattern
- Journey Duration - Avg, P95, max, min for the complete journey
- Step Performance - Detailed metrics for each individual process
- Wait Times - Statistics for time between each step
- Sample Instances - Real examples you can investigate further
Use Cases:
- Identify the "happy path" vs. exception paths
- Spot patterns with unusually long durations
- Find integration bottlenecks (high wait times)
- Compare performance across different journey variants
- Understand customer experience variations
Visual Features
Interactive Tree Visualization
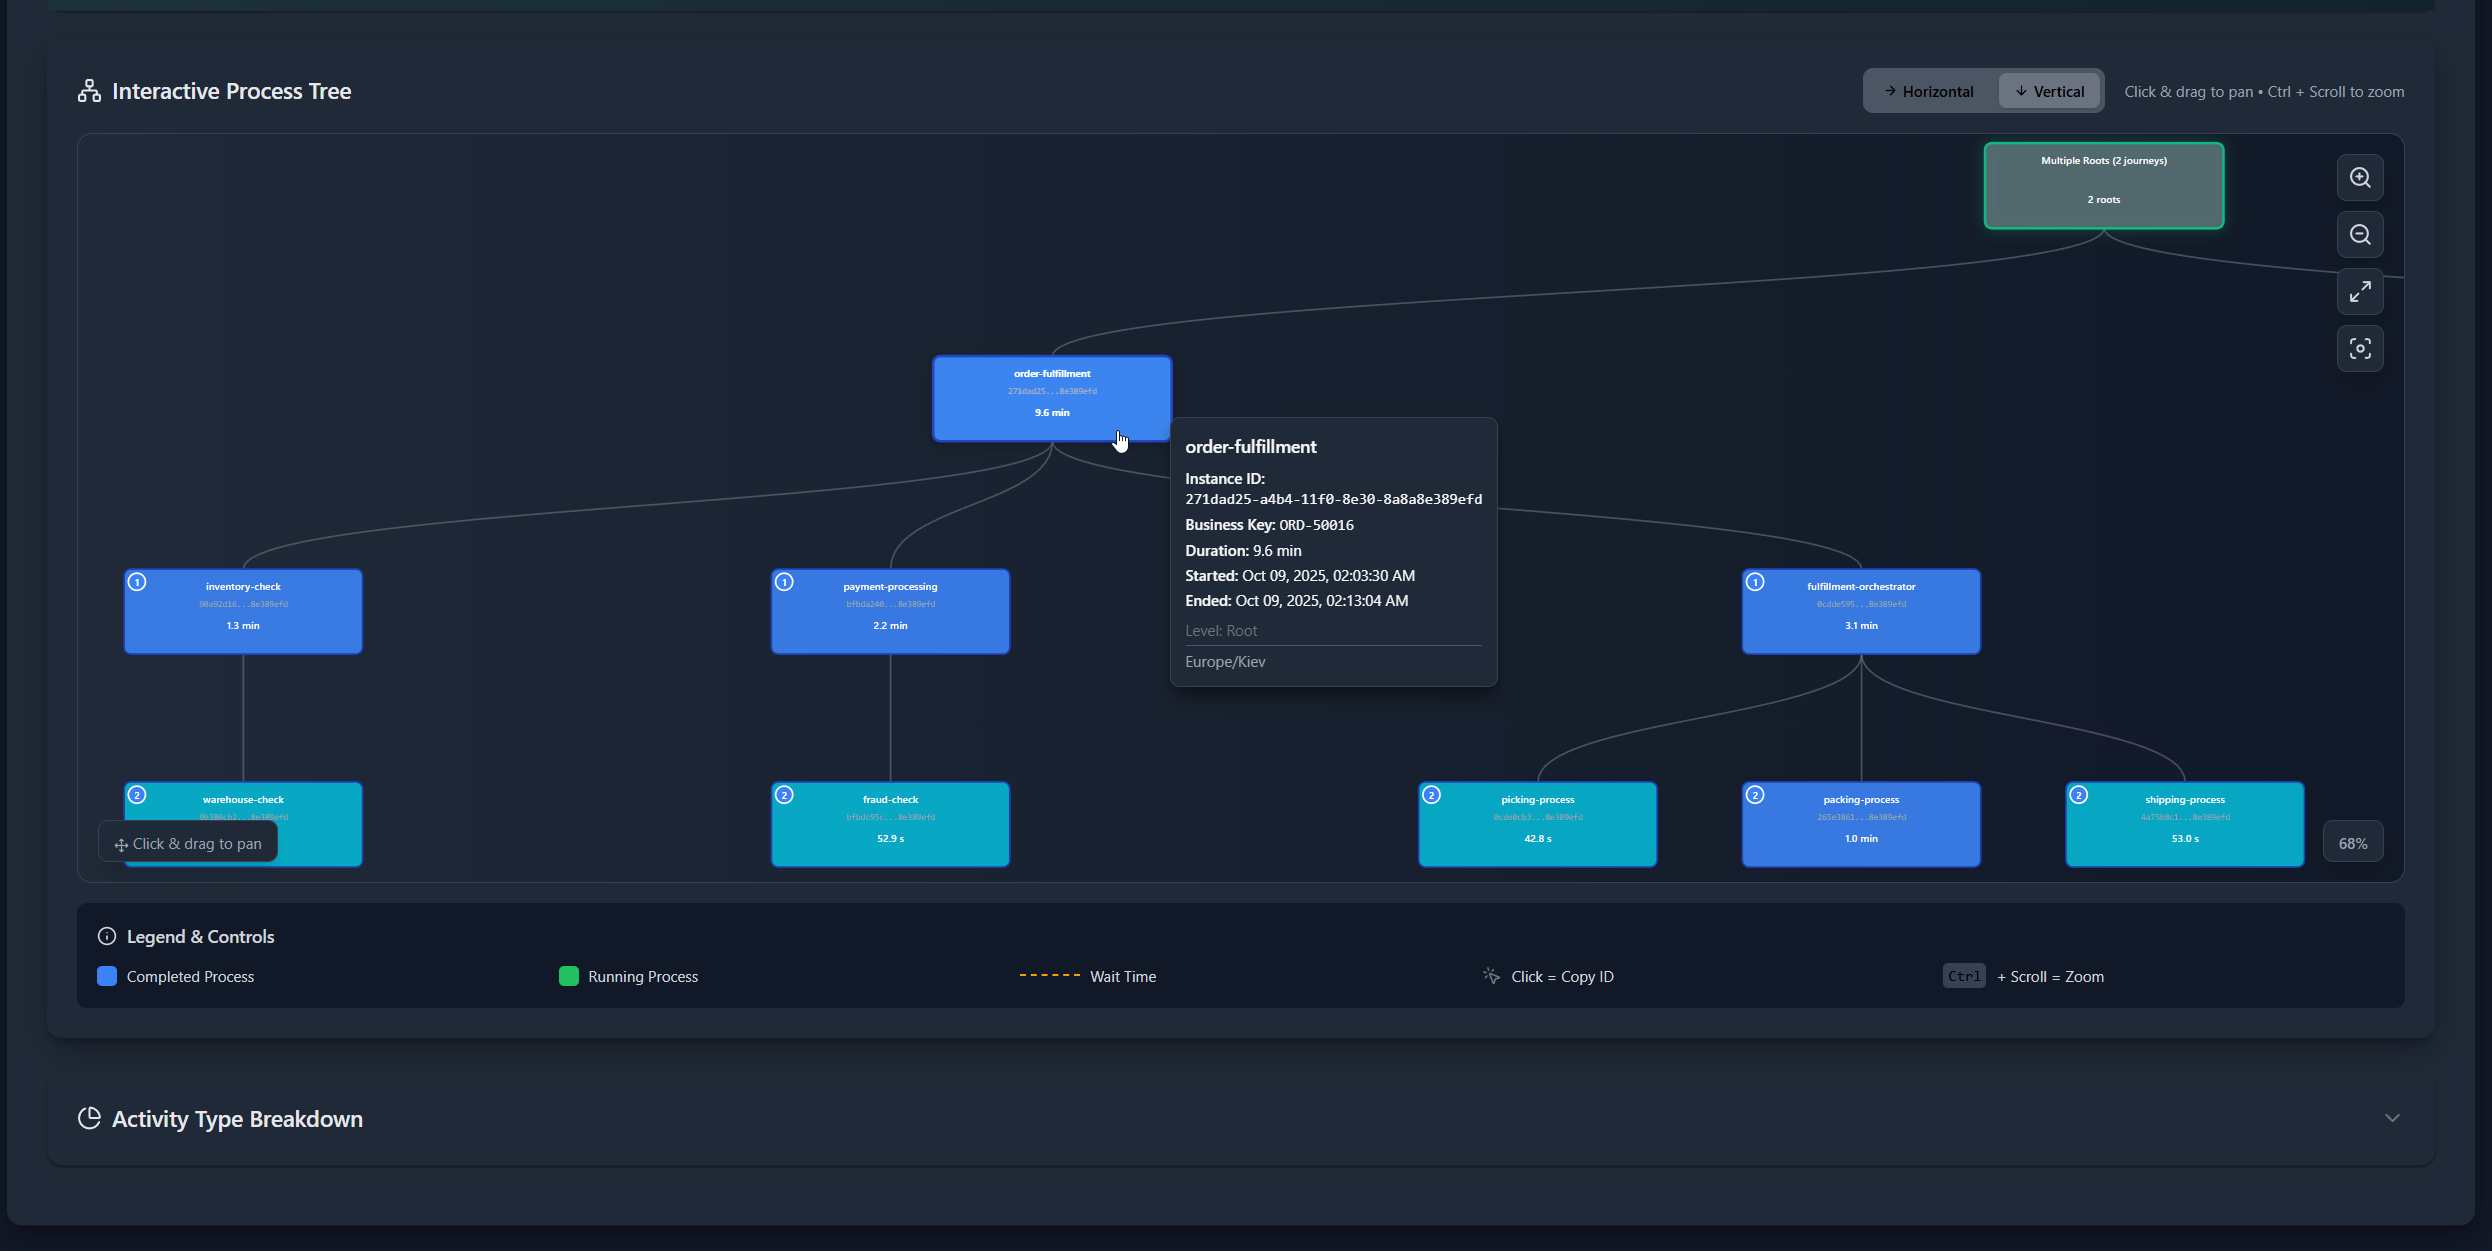
The D3.js-powered tree diagram offers:
Layout Options:
- Horizontal Layout - Processes flow left to right (default)
- Vertical Layout - Processes flow top to bottom
Visual Elements:
- Color-Coded Nodes - Cyan (very fast) → Blue (fast) → Orange (moderate) → Red (slow)
- Running Processes - Green with pulsing white dot
- Level Indicators - Numbered badges showing hierarchy depth
- Wait Time Links - Dashed amber lines with duration labels
- Hover Tooltips - Detailed information on hover
- Click to Copy - Click any node to copy instance ID
Navigation:
- Pan - Click and drag to move around
- Zoom - Ctrl + mouse wheel, or use zoom buttons
- Reset View - Click maximize button to fit all nodes
- Center View - Click focus button to center the tree
Timeline Chart
Built with Chart.js and zoom plugin:
Features:
- Dynamic height based on process count (scales from 400px to 900px)
- Minimum visible duration enforcement (ensures very short processes are still visible)
- Color-coded bars matching the tree visualization
- Precise tooltips with durations, timestamps, and status
- Full zoom and pan capabilities
Controls:
- Drag Selection - Drag to select area to zoom
- Shift + Drag - Pan horizontally
- Ctrl + Scroll - Zoom in/out
- Zoom Buttons - Click +/- buttons for incremental zoom
- Reset Button - Return to full view
Responsive Design:
- Adapts to container size
- Shows only essential labels when zoomed out
- Reveals detail when zoomed in
- Mobile-friendly touch interactions
Advanced Features
Expandable Row Details
Click the chevron icon on any row in the process table to reveal:
Instance History
- Complete event log for that specific instance
- Events grouped by type (Activity, Variable, Incident)
- Timestamps, event names, and details
- Duration for each event (where applicable)
- Color-coded badges (blue=activity, purple=variable, red=incident)
Summary Statistics
- Total events count
- Activities executed
- Variables set
- Incidents raised
This eliminates the need to navigate to separate pages for basic instance investigation.
Journey Statistics
The dashboard automatically calculates:
Duration Metrics:
- Total Duration - Earliest start to latest end (or now if running)
- Total Processing Time - Sum of all process durations
- Total Wait Time - Sum of all wait times between processes
- Processing vs. Waiting Ratio - Percentage breakdown
Completion Tracking:
- Number of completed processes vs. total
- Percentage complete
- Active/Running indicator for incomplete journeys
Structure Metrics:
- Maximum depth (longest call chain)
- Total process count
- Root process count (for parallel journeys)
Dark Mode Support
Journey Monitoring seamlessly adapts to your theme preference:
- Timeline chart recreates on theme toggle (preserves zoom state)
- Tree visualization updates colors for readability
- All UI elements follow theme
- Tooltips styled appropriately
- CSV export works in both modes
Performance Optimizations
Journey Monitoring is built for speed even with complex journeys:
Single Journey Tracing
Parallel Data Collection:
- Multiple database queries execute concurrently
- Instance details fetched in batch (single query for all instances)
- Hierarchical relationships gathered efficiently
- JIT (Just-In-Time) history loading only when rows expanded
Smart Network Expansion:
- Discovers all related instances through graph traversal
- Prevents circular references
- Limits maximum depth to prevent runaway queries
- Caches relationship maps
Lightweight Metadata:
- Removed expensive variable collection
- Streamlined activity counting
- Minimal overhead for initial load
Pattern Analysis
Pre-Calculated Patterns:
- Database generates pattern signatures using recursive CTEs
- Groups instances by pattern before sending to application
- Avoids building trees for every instance (10-100x faster)
- Only top 5 patterns get detailed step metrics
Batch Processing:
- Detailed metrics fetched in one query for all instances in a pattern
- Step statistics calculated client-side from batch data
- Limited to 100 instances per pattern for statistics (configurable)
Result Limits:
- Analyzes last 90 days of data by default
- Returns top 5 patterns
- Includes 3 sample instances per pattern
Configuration
Environment Variables
Customize these based on your business key conventions to ensure proper journey correlation.
Database Requirements
Tables Used:
act_hi_procinst- Process instance historyact_re_procdef- Process definitionsact_hi_actinst- Activity instance historyact_hi_incident- Incident historyact_ru_execution- Runtime executions
Indexes Recommended:
For optimal performance, ensure indexes on: - act_hi_procinst.business_key_ - act_hi_procinst.super_process_instance_id_ - act_hi_procinst.proc_inst_id_ - act_hi_procinst.start_time_
Use Cases
Operational Monitoring
Customer Support:
- Quickly trace a customer's complete journey when they call with issues
- Identify exactly where delays occurred
- See if processes are still running or stuck
- Share journey data with engineering teams
Incident Response:
- Find all incidents across a journey in one view
- Understand which subprocess failed in a complex chain
- See timing relationships between failures
Performance Analysis
Integration Bottlenecks:
- Identify which integration points have highest wait times
- Compare wait times across different patterns
- Find processes that start slowly after being called
Process Optimization:
- Discover rarely-used journey paths that might indicate errors
- Find patterns with consistently poor performance
- Compare "happy path" performance to exception paths
Compliance & Audit
Journey Documentation:
- Export complete journey data with timestamps
- Prove end-to-end processing times for SLA reporting
- Document exception handling paths
Process Validation:
- Verify all expected steps executed
- Ensure proper handoffs between systems
- Validate business key propagation
Architecture Planning
Microservices Design:
- Understand actual journey patterns vs. designed patterns
- Identify opportunities for process consolidation
- Find unnecessary wait times that could be eliminated
Capacity Planning:
- See peak concurrent process execution
- Understand typical journey depth
- Plan for scaling based on actual patterns
Best Practices
Designing for Journey Monitoring
1. Consistent Business Keys
- Propagate business keys to ALL related processes
- Use call activities with business key inheritance
- Set business keys early in process execution
- Use meaningful, human-readable keys (ORDER-123, CUST-456)
2. Message Correlation
- Always include business keys in message correlation
- Document your correlation key strategy
- Test that messages reach correct process instances
3. Process Naming
- Use descriptive process keys that indicate purpose
- Follow consistent naming conventions
- Avoid overly technical names (users see these in journey views)
Using Journey Monitoring Effectively
1. Start with Known Business Keys
- Use order IDs, customer IDs, or transaction IDs that you already track
- Test with recent, completed journeys first
- Validate that all expected processes appear
2. Investigate Wait Times
- High wait times often indicate:
- Message correlation issues
- External system delays
- Timer events or delays by design
- Process instances waiting in user task queues
3. Pattern Analysis Workflow
- Run pattern analysis monthly to spot trends
- Focus on patterns with high frequency or high duration
- Compare current patterns to previous months
- Investigate new patterns that appear
4. Performance Baselines
- Document "good" journey durations for each pattern
- Set alerts for journeys exceeding baselines
- Track P95 durations over time
Troubleshooting
Journey Not Found
- Verify business key exists in at least one process instance
- Check for typos or extra characters
- Try searching with the process instance ID instead
- Confirm business key normalization settings match your format
Incomplete Journey
- Some processes might not have business keys set
- Call activities might not be properly configured
- Message correlation might have failed
- Check that
superProcessInstanceIdis set for subprocesses
Pattern Analysis Shows No Data
- Ensure there are completed instances (not just active ones)
- Verify the time range (last 90 days by default)
- Check that the selected process is actually a root process
- Confirm at least one instance completed fully
Performance Issues
- Large journeys (50+ processes) may load slowly
- Consider archiving old process instances
- Limit pattern analysis to specific versions
- Add recommended database indexes
API Reference
REST Endpoints
| Endpoint | Method | Description |
|---|---|---|
/journey/monitoring | GET | Main page (requires journey_analysis_data permission) |
/journey/api/trace | GET | Trace single journey by business key or instance ID |
/journey/api/patterns | GET | Analyze journey patterns for a process |
Query Parameters
Journey Tracing:
Pattern Analysis:
GET /journey/api/patterns?process_key=order-process&version=3
GET /journey/api/patterns?process_key=order-process  (all versions)
Response Format
Journey Trace Response:
{
  "journey_tree": { /* hierarchical tree structure */ },
  "metadata": {
    "business_key_search": "ORDER-12345",
    "total_instances": 5,
    "total_roots": 1,
    "total_activities": 24,
    "total_events": 87,
    "has_incidents": false,
    "is_active": false
  },
  "incidents": [ /* array of incident details */ ]
}
Pattern Analysis Response:
{
  "process_key": "order-process",
  "version": 3,
  "total_instances": 150,
  "patterns": [
    {
      "pattern": "Order → Payment → Fulfillment",
      "count": 120,
      "percentage": 80.0,
      "total_duration": {
        "avg": 3600000,
        "p95": 7200000,
        "max": 10800000,
        "min": 1800000
      },
      "step_metrics": { /* per-process stats */ },
      "wait_metrics": { /* inter-process wait times */ },
      "sample_instances": [ /* example instance IDs */ ]
    }
  ]
}
FAQ
Q: Can I trace journeys across multiple Camunda clusters?
A: Currently, Journey Monitoring works within a single cluster. For multi-cluster scenarios, ensure business keys are unique across clusters and query each separately.
Q: How far back can I trace journeys?
A: Journey Monitoring can trace any journey still in the history tables. Performance is best for recent journeys (last 90 days).
Q: What if my processes don't use business keys?
A: Business keys are essential for journey correlation. If you don't use them, you can only trace by specific instance ID, which will show parent-child relationships but not correlated processes.
Q: Can I exclude certain processes from journey traces?
A: Journey Monitoring shows all processes connected to the business key. If you want to filter the view, consider using different business keys for different journey segments.
Q: How do I optimize journey tracing performance?
A: Ensure database indexes on business keys and timestamps. Consider archiving old completed instances. For pattern analysis, specify a version rather than analyzing all versions.
Q: Can I customize the business key normalization logic?
A: Yes, configure BUSINESS_KEY_DELIMITERS in your config to match your business key conventions.
Q: What happens with circular process dependencies?
A: The tree builder includes circular reference detection and maximum depth limits to prevent infinite loops.
Q: Can I export journey data for reporting?
A: Yes, use the "Export CSV" button in single journey mode to download complete journey data including all timestamps, durations, and wait times.

