Process History
The Process History module provides a comprehensive audit trail and deep-dive analysis for every process instance, enabling detailed retrospective debugging and compliance verification.
Overview
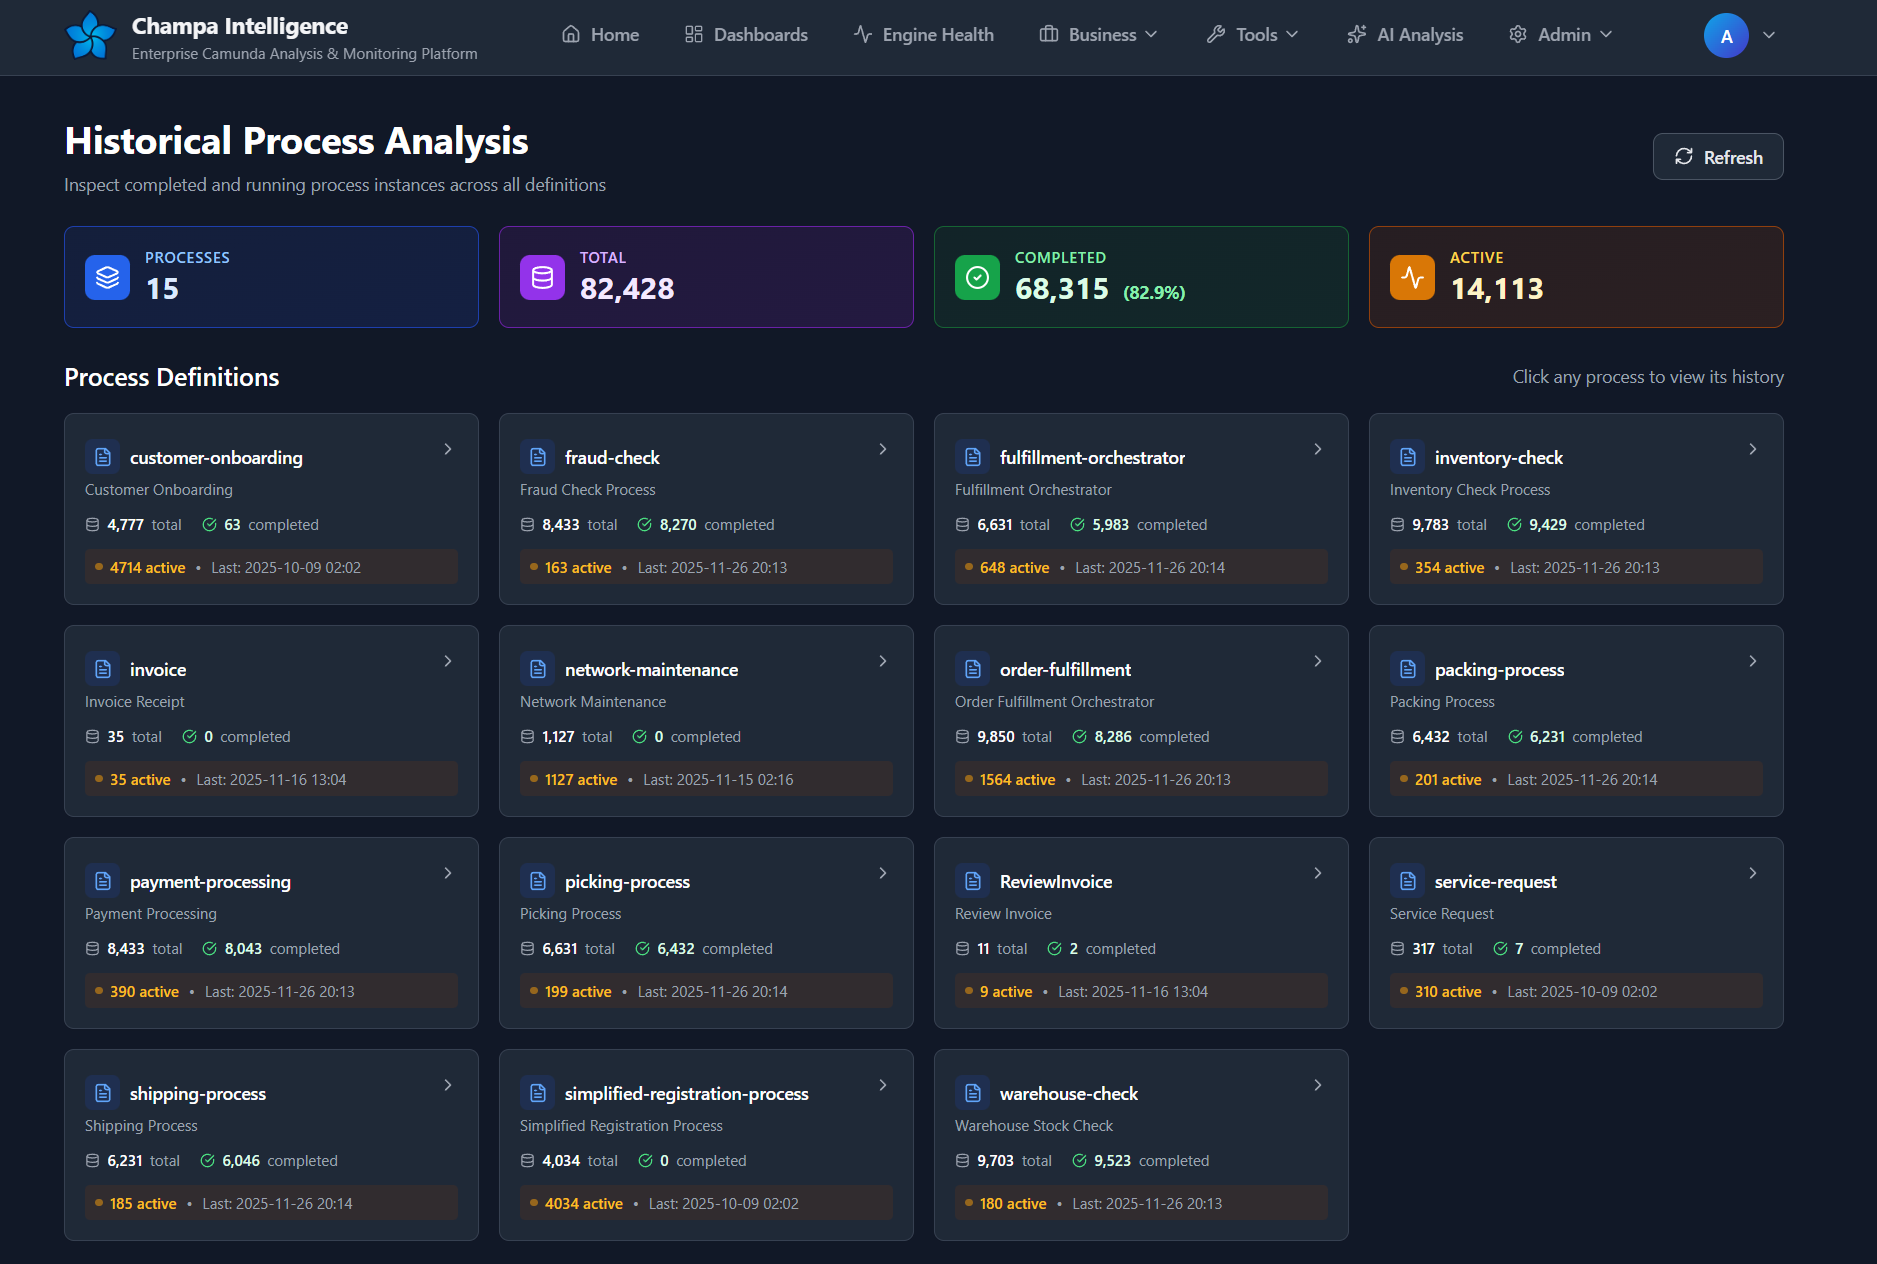
The Historical Process Analysis center allows you to inspect completed and running process instances across all definitions, serving as your primary tool for "forensic" process analysis.
Key Capabilities
- 📜 Complete Audit Trail - Chronological history of every activity
- 🔍 Deep Variable Inspection - Track variable changes over time
- 📊 Performance Context - Activity duration analysis vs historical averages
- 🔗 Subprocess Navigation - Seamlessly traverse call hierarchies
- 🚦 Gateway Decision Analysis - Understand routing logic
- 🐛 Incident History - Full error context and stack traces
Navigating Process History
1. History Overview
Your entry point for historical analysis
What you see:
- Global Statistics: Total processes, instances, completion rates, and active counts.
- Process Definition Grid: All deployed processes with their individual health stats.
- Active Indicators: Pulsing indicators for processes with currently running instances.
Key Actions:
- Click any process card to view its Instance List.
- Use the Refresh button to get the latest data.
2. Instance List View
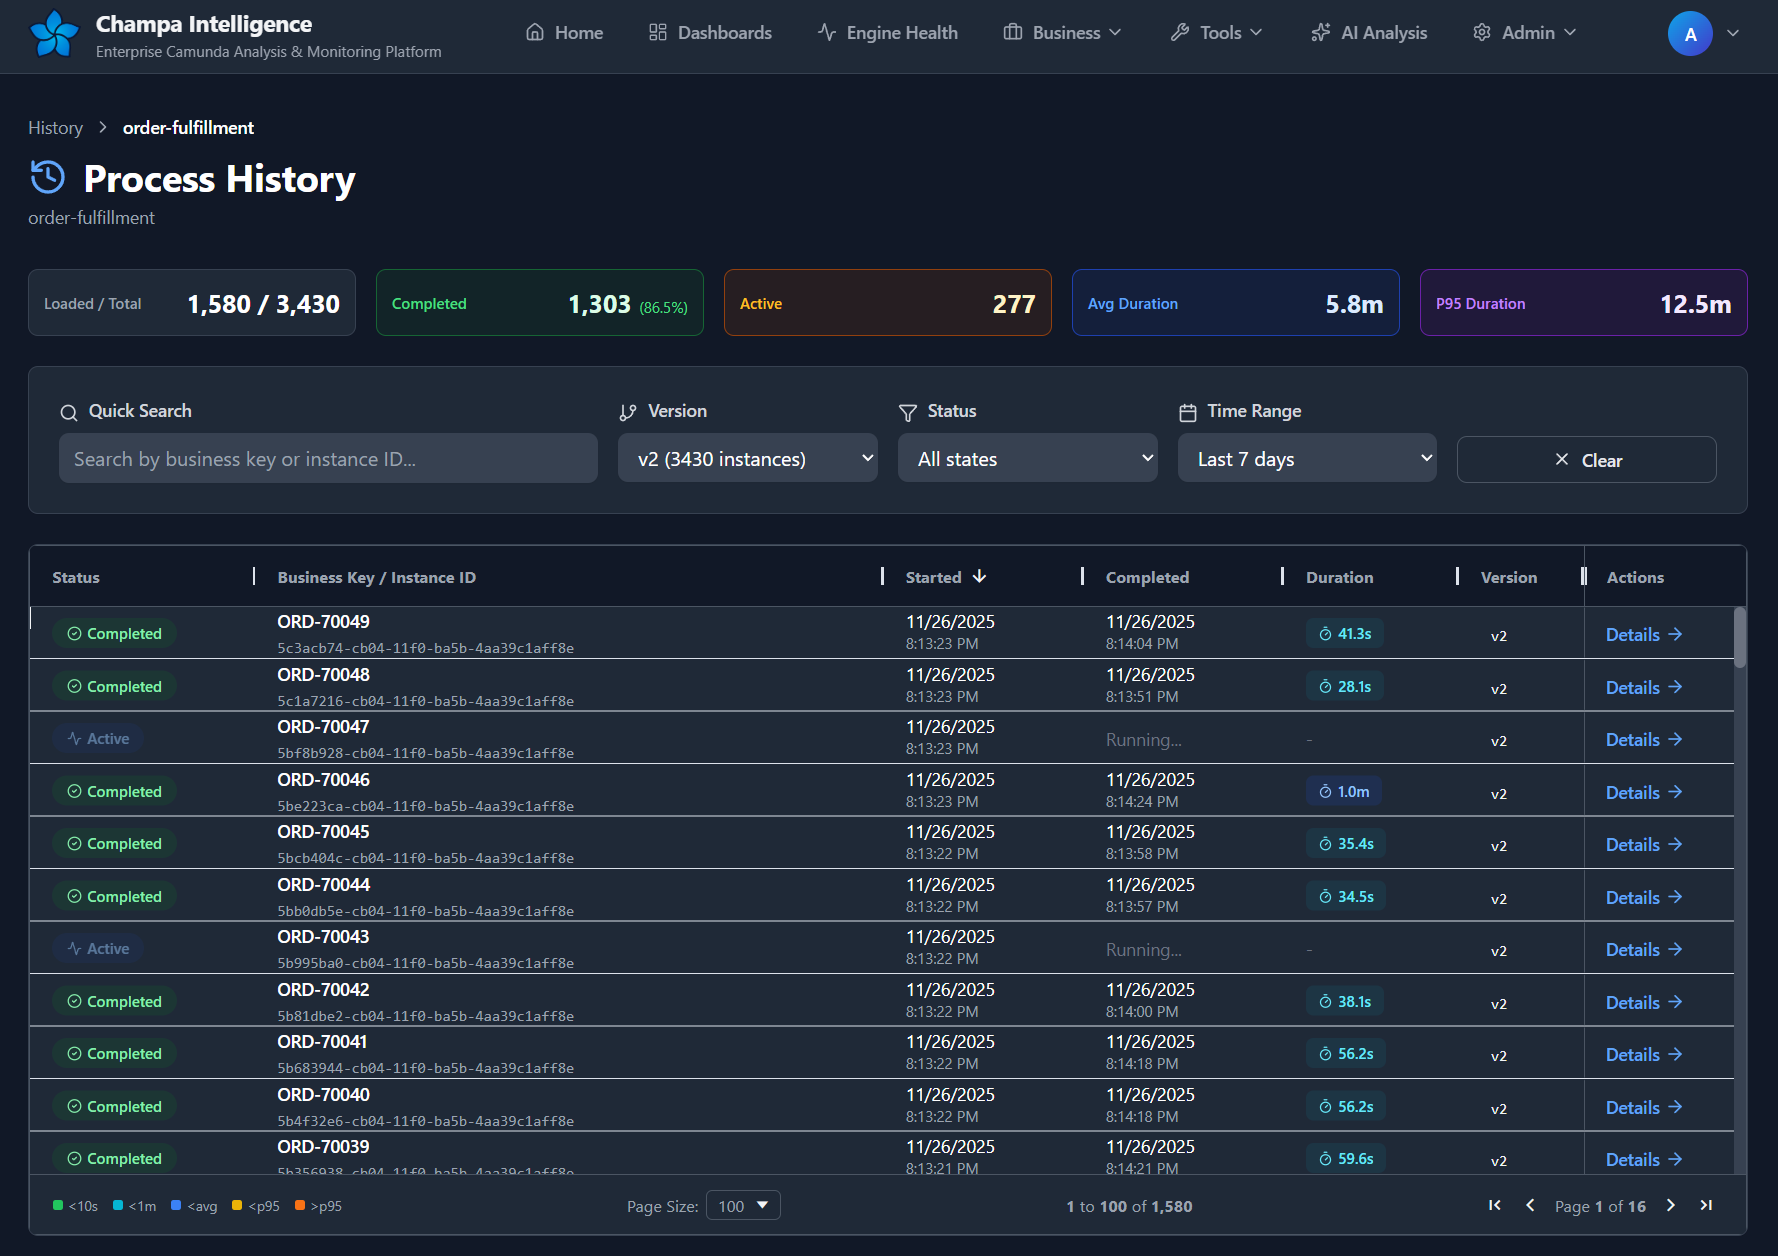
Filter and find specific executions
Features:
- Advanced Filtering: Filter by Version, State (Active/Completed), and Time Range (up to 30 days).
- Performance Summary: Instant calculation of Avg, Median, and P95 durations for the filtered set.
- Status Indicators: Color-coded badges for Completed (Green), Active (Blue), and Incident (Red) states.
Use for:
- Finding a specific customer order or transaction.
- Analyzing performance trends for a specific version.
- Identifying failed instances requiring attention.
Deep Dive: Instance Detail View
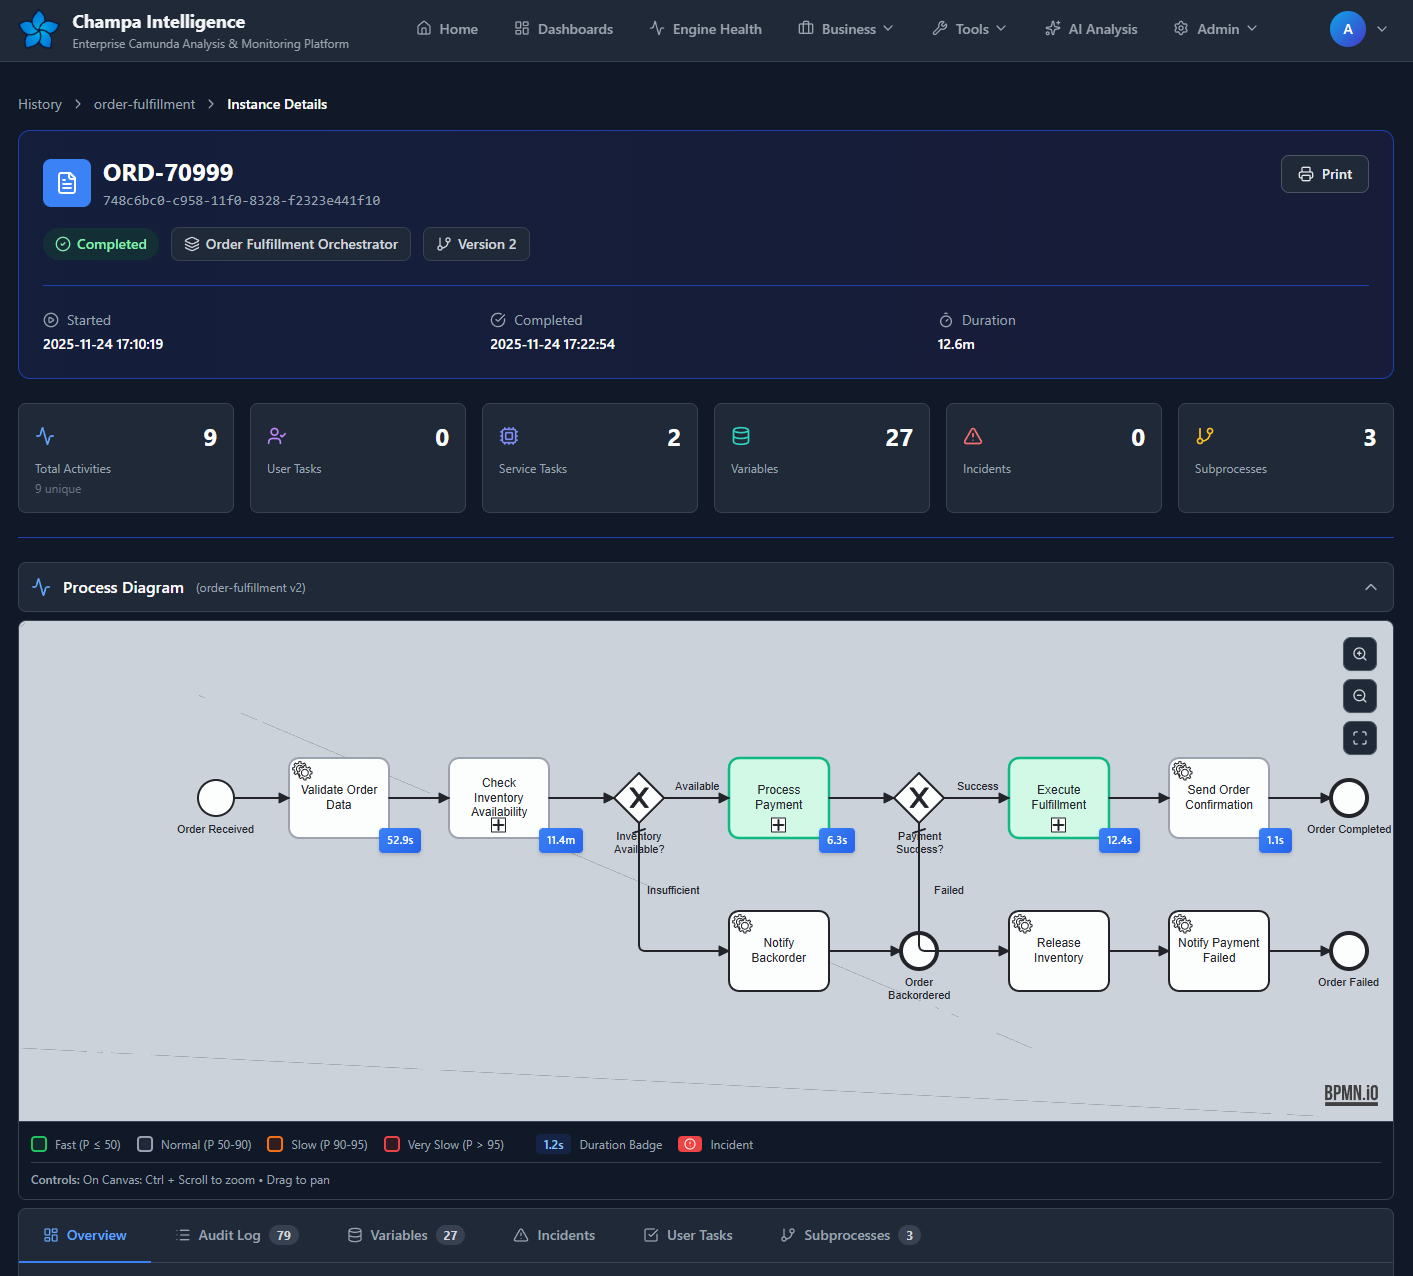
Clicking any instance ID opens the Instance Detail View, the most powerful diagnostic tool in the platform.
Core Analysis Tabs
⏱️ Timeline & History
A chronological feed of every event in the process lifecycle. - Start/End Times: Precise timestamps for every activity. - Duration: Execution time for each step. - Activity Type: Icons distinguishing User Tasks, Service Tasks, Gateways, etc.
📦 Variables & Data
Advanced data inspection capabilities: - Current State: Final values of all variables. - Variable History: Track how a variable changed value at each step. - Impact Analysis: See which variables influenced process routing. - Correlations: Discover relationships between variables.
⚡ Performance Context
Understand why a process was slow. - Activity Duration: How long this specific step took. - Historical Comparison: Compares against the process average. - Outlier Detection: Flags activities that were significantly slower than normal.
🛑 Incidents & Errors
Full error context for debugging. - Error Messages: Full stack traces and exception messages. - Timestamps: When the error occurred. - Resolution Status: Whether the incident is Open or Resolved.
🔄 Subprocesses & Call Activities
- Hierarchy View: See called subprocesses.
- Navigation: Click to jump into the child process instance context.
🔀 Gateway Decisions
- Routing Logic: See which path was taken at exclusive gateways.
- Expression Evaluation: Understand why a specific path was chosen.
Technical Details
API Access
The History module exposes several APIs for custom integration:
GET /history/api/instance/<id>/details
GET /history/api/process/<key>/statistics
GET /history/api/instance/<id>/variable-history
Performance Optimization
- ThreadPoolExecutor: The detail view uses parallel execution to fetch history, variables, and stats concurrently, ensuring fast load times even for complex instances.
- Pagination: The Instance List supports server-side pagination to handle thousands of records efficiently.


